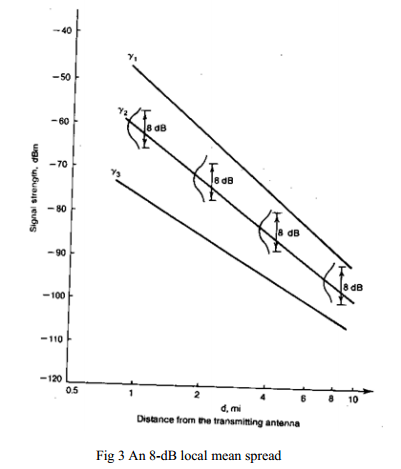
Why there is a constant standard deviation along a path-loss curve
3. Why there is a constant standard deviation along a path-loss curve.
When plotting signal strengths at any given radio-path distance, the deviation from predicted value. is approximately 8 dB.1012 This standard deviation of 8 dB is roughly true in many different areas. The explanation is as follows. When a line-of-sight path exists, both the direct wave path and reflected wave path are created and are strong. When an out-of-sight path exists, both the direct wave path and the reflected wave path are weak. In either case, according to the theoretical model, the 40-dB/dec path-loss slope applies. The difference between these two conditions is the 1-mi intercept (or 1-km intercept) point. It can be seen that in the open area, the 1-mi intercept is high. In the urban area, the 1-mi intercept is low. The standard deviation obtained from the measured data remains the same along the different path-loss curves regardless of environment.
Support for the above argument can also be found from the observation that the standard deviation obtained from the measured data along the predicted path-loss curve is approximately 8 dB. The explanation is that at a distance from the cell site, some mobile unit radio paths are line-of-sight, some are partial line-of-sight, and some are out-of-sight. Thus the received signals are strong, normal, and weak, respectively. At any distance, the above situations prevail. If the standard deviation is 8 dB at one radio-path distance, the same 8dB will be found at any distance. Therefore a standard deviation of 8 dB is always found along the radio path as shown in Fig.3. The standard deviation of 8 dB from the measured data near the cell site is due mainly to the close-in buildings around the cell site. The same standard deviation from the measured data at a distant location is due to the great variation along different radio paths.


