Explain the Trunking Efficiency
13. Explain the Trunking Efficiency.
Trunking Efficiency:
To explore the trunking efficiency degradation inherent in licensing two or more carriers rather than one, compare the trunking efficiency between one cellular system per market operating 666 channels and two cellular systems per market each operating 333 channels. Assume that all frequency channels are evenly divided into seven subareas called cells. In each cell, the blocking probability of 0.02 is assumed. Also the average calling time is assumed to be 1.76 min.
With N1=666/7 = 95 and B= 0.02 to obtain the offered load A1 =83.1 and with N2=333/7=47.5 and B=0.02 to obtain A2= 38. Since two carriers each operating 333 channels are considered, the total offered load is 2A. We then realize that
By converting above eqn. to the number of users who can be served in a busy hour, the average calling time of 1.76 mm is introduced. The number of calls per hour served in a cell can be expressed as
 |
| Degradation of trunking efficiency |
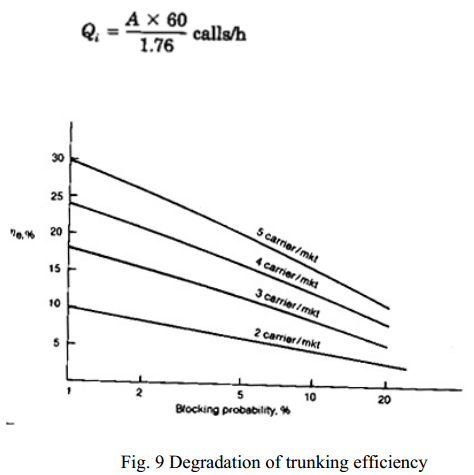
For a blocking probability of 2 percent, Figure 13 shows, by comparing one carrier per market with more than one carrier per market situations with different blocking Probability conditions. The degradation of trunking efficiency decreases as the blocking probability increases. As the number of carriers per market increases the degradation increases. However, when a high percentage of blocking probability, say more than 20 percent, occurs, the performance of one carrier per market is already so poor that further degradation becomes insignificant, as Fig.9 shows.
 |
| trunking efficiency factor |
For a 2 percent blocking probability, the trunking efficiency of one carrier per market does show a greater advantage when compared to other scenarios.

